Kingaroy
Queensland · Burnett, Wide Bay
Live · ABS ERP June 2025
Kingaroy has 5 schools (3 government, 2 non-government; ACARA School Profile 2025) and 11 NQS-rated childcare services (ACECQA register). Population is 11,059 (ABS ERP June 2025).
Kingaroy at a glance
Found this useful? Share it with a friend who is moving.

Boundaries: ABS Suburbs & Localities 2021. School pins are ACARA's published locations. Map © OpenStreetMap contributors, © CARTO. Open the full QLD map →
How the Family-Fit score is built65/100
Family-Fit score
Method published in fullStrong for families - strongest on childcare & early years, weakest on socio-economic profile.
- Schools in the area · 20% of the score
- 66/100
- Childcare & early years · 15% of the score
- 100/100
- Everyday amenities · 15% of the score
- 75/100
- Housing affordability · 15% of the score
- 58/100
- Families already here · 10% of the score
- 58/100
- Socio-economic profile · 10% of the score
- 11/100
QLD median 61/100
5 schools in this SA2 · average government-school ICSEA 928
QLD median 60/100
11 NQS-rated services nearby
QLD median 73/100
27 parks · 1 GP · 5 supermarkets · 3 playgrounds
QLD median 51/100
Paying over 30% of income on housing: 7.8% of mortgage-holding households, 30.6% of renting households
QLD median 64/100
19.9% of residents are children aged 0–14 · 35.3% of families are couples with children
QLD median 44/100
SEIFA IRSAD decile 2 of 10 nationally
The grey marker on each bar is the median across the 484 Queensland areas we publish a score for (state median overall: 58/100). It is context, not a pass mark.
Not scored here (no published data for this area, so it is left out rather than counted as zero): Getting around. The remaining inputs were rescaled to 100.
How this score is calculated
Each published figure for the Kingaroy SA2 is mapped onto 0–100 by fixed thresholds, then weighted. Inputs with no data here are dropped and the rest rescaled - never scored as zero. Every threshold and weight →
School results, crime and flood or bushfire overlays are not graded into this score. Limits of the score →
What families notice
What families notice
- This address is zoned to Kingaroy State School (government, no fees).
- 27 parks mapped inside this SA2 (OpenStreetMap).
- 5 schools sit inside this SA2 - more choice than most areas this size.
- We don't yet have official crime data for QLD (only NSW and VIC) - that's a data gap on our side, not a claim this area is safe.
- About 31% of renters here spend over 30% of income on rent - above the standard affordability guideline (ABS Census 2021).
- We don't yet have property or rent figures for this area - check a real-estate portal directly for current prices.
Living in Kingaroy: family snapshot
Living in Kingaroy
A mid-sized suburb. Many childcare options nearby - 11 NQS-rated services. Mostly detached family homes.
Kingaroy compared with Queensland10 measures
| Measure | Kingaroy | QLD average | Against QLD |
|---|---|---|---|
| Children aged 0 to 4 | 6.5% | 5.7% | About the same |
| Children aged 5 to 14 | 13.5% | 13.0% | About the same |
| Couple families with children | 35.3% | 41.0% | Lower |
| One-parent families | 20.1% | 17.0% | Higher |
| Homes owned outright | 33.1% | 29.3% | Higher |
| Homes owned with a mortgage | 28.6% | 35.6% | Lower |
| Homes rented | 36.9% | 33.2% | Higher |
| Separate houses | 86.3% | 76.6% | Higher |
| Flats and apartments | 8.6% | 11.1% | Lower |
| Born overseas | 10.7% | 22.7% | Lower |
Source: ABS Census 2021. The QLD figure is the population-weighted average of the 543 QLD areas with a published value. "Higher" and "Lower" describe the number only.
About this area and its boundary
Kingaroy is a locality in the Burnett area of Queensland. This profile draws on ABS population and Census figures, the ACARA school register and ACECQA childcare ratings for the Kingaroy SA2.
11,059 residents - 19.9% are children under 15, median age 38.
This profile uses the ABS Kingaroy statistical area (SA2) - the level Australian government data is published at. SA2 boundaries don’t always match suburb boundaries. It covers the gazetted suburb of Kingaroy, drawn separately on the map above.
Property market
No free house sale price or 3-bedroom house rent is published for this area. 36.9% of homes are rented, against 33.2% across Queensland.
Homes and households
Source: ABS Census 2021. Where the shares do not add to 100%, the rest is "other" or "not stated".
Housing cost pressuremortgage and rent against income
Housing cost pressure
In Kingaroy, 30.6% of renting households spend more than 30% of their income on rent, and 7.8% of households with a mortgage spend more than 30% on repayments - the ABS's stretched-household threshold (Census 2021).
ABS published figures, not our calculation.
- Mortgage over 30% of income
- 7.8%
- Rent over 30% of income
- 30.6%
QLD avg 11.9%
Share of households WITH a mortgage whose repayments take more than 30% of income. That's 87 of 988 households with a stated repayment.
QLD avg 32.3%
Share of RENTING households whose rent takes more than 30% of income. That's 441 of 1,304 households with a stated rent.
The two figures cover different households (mortgage-holding vs renting), so never add them. How the ABS counts these → Grey marker: QLD average (520 for mortgage and 528 for rent). Census 2021 - housing costs have moved since. Not financial advice.
What's being built herenew homes approved, year by year
What's being built here
41 new homes were approved in Kingaroy in the year to June 2025. Councils approved 169 new dwellings here across the 6 years to June 2025 - an approval is permission to build, not a home that exists yet.
Approved in the year to June 2025
Middle QLD area: 31
Separate houses
Private sector, over these 6 years
Townhouses & apartments
Private sector, over these 6 years
Counts are for the whole Kingaroy statistical area. What these counts include → Dashed line: the median of 487Queensland areas.
Schools and childcare
5 schools are located in the area, and the centre of the area is zoned to Kingaroy State School. 11 childcare services are on the national register, 7 rated Meeting the National Quality Standard or above.
Kingaroy State School
The government school your child can attend for free by living in Kingaroy.
This is the zoned government school for the centre of Kingaroy (QLD catchment data) - addresses elsewhere in the suburb may be zoned to a different school.
See the catchment on the mapThe government Year 7 zone for the centre of Kingaroy (QLD catchment data) - addresses elsewhere in the suburb may be zoned to a different school.
Fee-paying schools can’t be enrolled in by zone - they’re shown for context, not as the area’s school quality.
We show school intake context and catchments, not exam results. We don’t publish a school ranking.
All school zones in the South Burnett council area →
To look beyond Kingaroy, every Queensland school is on the Australian schools and catchment zones map.
Find the school zone for an address in Kingaroy
Type a street address in Victoria, NSW or Queensland. We show the government primary and secondary school zones it is in, from the official zone maps.
Your address goes from your browser straight to OpenStreetMap's address search to find it on the map. We never see it or store it. Address search © OpenStreetMap contributors.
Schools in Kingaroy
- Students
- 325
- ICSEA
- 908
- Students
- 946
- ICSEA
- 942
- Students
- 692
- ICSEA
- 1010
- Students
- 394
- ICSEA
- 934
- Students
- 288
- ICSEA
- 984
ICSEA reflects student intake context, not teaching quality (1000 = national average). Source: ACARA School Profile 2025. All QLD schools →
Childcare: 11 services
National Quality Standard ratings from the ACECQA register, refreshed Oct 2026. Services are matched by suburb name.
Childcare services, ratings and fees11 services
- Exceeding NQSSt Johns Lutheran Kindergarten KingaroyCentre-Based Care · 22 places · KingaroyRated May 2023 · over 3 years old, check for a more recent assessment
- Meeting NQSLittle Peanuts Early Learning CentreCentre-Based Care · 75 places · KingaroyRated Oct 2024
- Meeting NQSGoodstart Early Learning KingaroyCentre-Based Care · 74 places · KingaroyRated Mar 2026
- Meeting NQSHaly Street Early LearningCentre-Based Care · 74 places · KingaroyRated Oct 2026
- Meeting NQSSouth Burnett Child Care CentreCentre-Based Care · 61 places · KingaroyRated Jan 2026
- Meeting NQSPeanut Kids Kindy & After School CareCentre-Based Care · 38 places · KingaroyRated May 2022 · over 3 years old, check for a more recent assessment
- Meeting NQSC&K Kingaroy Community KindergartenCentre-Based Care · 22 places · KingaroyRated Sep 2026
- Working Towards NQSKidz Mob TaabingaCentre-Based Care · 59 places · KingaroyRated May 2024
- Working Towards NQSKing St Early Learning CentreCentre-Based Care · 45 places · KingaroyRated Feb 2024
- Not yet ratedBloom Early Learning KingaroyCentre-Based Care · 66 places · Kingaroy
- Not yet ratedKidz Mob KingaroyCentre-Based Care · 45 places · Kingaroy
- Centre-based day care
- $12.82/hr
Mean hourly fee across CCS-approved services, December quarter 2025 - Dept of Education, © Commonwealth of Australia, CC BY 4.0. Published at SA3 level (a wider area than this suburb's SA2), so it's an average across Burnett and surrounds, not this specific service list.
Verify locations before visiting. A rating over 3 years old is flagged. What the NQS ratings mean → Childcare places per child, by suburb →
Who lives here
Fewer people born overseas than Queensland overall: 10.7% of residents, against 22.7% statewide.
Ages of people here
Share of residents in each age band, in years. Source: ABS Census 2021.
How the area is changingCensus 2011 to 2021
Each line is drawn on its own scale, so compare the numbers, not the heights. Source: ABS Census 2011, 2016 and 2021.
Census trends against the middle QLD areafull charts
Which way this area is moving
The 2011, 2016 and 2021 Censuses for Kingaroy, counted on today's boundaries.
Since 2011, Kingaroy has grown older, with a smaller share of children, more residents born overseas and more residents speaking another language at home.
- People counted
- +739 people since 2011
- Median age
- +3 years since 2011
- Children aged 0–14
- −3.8 pts since 2011
- Born overseas
- +2.3 pts since 2011
- Speak another language at home
- +2.7 pts since 2011
Usual residents counted on Census night.
Half the residents are older than this, half younger.
Share of all residents. The clearest signal of families arriving or moving on.
Share of all residents born outside Australia.
Share of residents who stated a language, speaking one other than English at home.
The dashed line is the median across the Queensland areas we profile. How the three Censuses line up →
Where this year's population change came from+0.50% in a year
Where did the gain come from?
+59Reading the streams: overseas arrivals were the dominant force - more came from abroad than the suburb grew on its own.
Ages against the state average, band by band
Ages of people here
13.5% of people here are school-age children (5–14) - about the Queensland average of 13%, and 6.5% are under 5. The median age is 38.
- 0–4 years · before school
- 6.5%
- 5–14 years · school age
- 13.5%
- 15–19 years · teens
- 6.3%
- 20–34 years
- 19.7%
- 35–54 years
- 21.7%
- 55–64 years
- 11.3%
- 65 years and over
- 21.1%
QLD avg 5.7%
QLD avg 13%
QLD avg 6.1%
QLD avg 19.9%
QLD avg 26.4%
QLD avg 11.9%
QLD avg 17%
Share of all residents of Kingaroy (ABS Statistical Area 2) at the 2021 Census; the grey marker is the Queensland average. How the bands and averages work →
Households and families
Households and families
55% of families here have children living at home - fewer than the Queensland average of 58%. The largest overseas-born communities are United Kingdom (2.1%), New Zealand (1.7%) and Philippines (1.2%). 37% of homes are rented.
Family make-up
Share of all families in the area. A small "other family" group the ABS also counts is not shown.
- Couple with children
- 35.3%
- One-parent family
- 20.1%
- Couple, no children
- 42.6%
QLD avg 41%
QLD avg 17%
QLD avg 40.4%
What people live in
Share of occupied private dwellings. Other and unstated structures are not shown.
- Separate house
- 86.3%
- Semi-detached / townhouse
- 4.6%
- Flat or apartment
- 8.6%
QLD avg 76.6%
QLD avg 11.5%
QLD avg 11.1%
Owned or rented
Share of occupied private dwellings. Other and unstated tenures are not shown.
- Owned outright
- 33.1%
- Owned with a mortgage
- 28.6%
- Rented
- 36.9%
QLD avg 29.3%
QLD avg 35.6%
QLD avg 33.2%
Figures describe Kingaroy (ABS Statistical Area 2) at the 2021 Census; the grey marker is the Queensland average. How these are counted →
Birthplaces, languages and communities
Who lives in Kingaroy
Top 5 overseas birthplaces shown · 93.8% born in Australia or a country not in the top five.
- United Kingdom · established by 2016
- 2.1%
- New Zealand · established by 2016
- 1.7%
- Philippines · established by 2016
- 1.2%
- South Africa · growing since 2016
- 0.7%
- Taiwan · growing since 2016
- 0.5%
QLD avg 4.4%
QLD avg 4%
QLD avg 0.7%
QLD avg 0.8%
QLD avg 0.1%
- Nearby
- Nanango, Kingaroy Surrounds - North and Crows Nest - Rosalie also have an established United Kingdom community.
- Settlement pattern
- Of overseas-born residents who stated when they arrived, 25.2% arrived in the last 5 years (2016–2021) (QLD avg 15.8%) and 44.7% arrived before 2001 (QLD avg 45.9%).
- English at home
- Of residents who speak a language other than English at home and stated their English proficiency, 14.2% report speaking English “not well” or “not at all” (QLD avg 11.3%) - a self-reported ABS figure across all languages combined, not a judgement of any one community.
Figures describe Kingaroy (ABS Statistical Area 2) at the 2021 Census. The ABS publishes only the five largest communities per area, so a missing name did not rank in the top five. How these are counted →
Socio-economic index (SEIFA)decile 2 of 10
- Decile (1 lowest, 10 highest)
- Decile 2 of 10
- Where this sits in QLD
- bottom 20% of Queensland areas
A relative comparison of the whole area against all of Australia - not a safety, liveability, or school-quality measure. What IRSAD measures → Source: ABS SEIFA 2021, IRSAD index (SA2).
Getting around and lifestyle
5 supermarkets, 1 GP and 27 parks are mapped in the area, and the nearest emergency department is Kingaroy Hospital, 0.3 km away in a straight line.
Mapped inside the Kingaroy boundary. A zero can mean "not mapped" rather than "not there". Source: © OpenStreetMap contributors.
Train to the city and nearest emergency department
Train to the city
Not publishedNo station within reach of the middle of this area appears in the Queensland timetable feed, so we show no train travel time. Buses are not covered anywhere on this site.
Nearest emergency department
MappedKingaroy Hospital · 0.3 km
Straight-line distance from the middle of this area - not a drive time. In an emergency call 000; do not plan around this figure.
Community and recreation
Out with a baby
Public-toilet facilities recorded on the National Public Toilet Map - not every place in the area that will let you change a baby.
About this data
Counts of features tagged in OpenStreetMap inside the Kingaroy boundary. “Middle QLD area”: the median of 538 Queensland areas. How these counts and times are made →
Source: © OpenStreetMap contributors · baby-facility counts from the National Public Toilet Map (Continence Foundation of Australia, funded by the Australian Government Department of Health, Disability and Ageing, CC BY 3.0 AU)
Crime & safety in Kingaroy
Official recorded-incident data is only published on this site for NSW and VIC so far - that's a coverage gap on our side, not a claim that Kingaroy is safe. SuburbRadar does not rate suburbs as safe or unsafe. More on crime & safety →
Risks
1 of the 1 planning and hazard records we hold show something in this area: traffic noise. 6 more are not published for QLD - treat them as not checked.
Traffic noise
Main roads onlyYoungman Street · D'Aguilar Highway · Haly Street · +8 more
Each line is the extent of an official record across the whole Kingaroy area - not a risk rating, and a specific address may or may not be affected. Not financial or insurance advice.
All 9 checks and what each one means
Flooding
Not publishedNo free statewide flood overlay is published for QLD yet, so we show none. Check the local council's planning maps.
Bushfire
Not publishedWe hold official bushfire mapping for Victoria and New South Wales only - nothing is published here for QLD yet. Check the state fire service's mapping.
Heritage controls
Not publishedWe hold official heritage overlay mapping for Victoria and New South Wales only - nothing is published here for QLD yet. Check the local council's planning scheme and the state heritage register.
Traffic noise
Main roads onlyYoungman Street · D'Aguilar Highway · Haly Street · +8 more
No freeway or highway is mapped inside this area. 11 named main roads (arterial or connector) run through it. Roads are counted by name, not by mapped segment.
Aircraft noise
Not publishedWe hold official aircraft-noise mapping for Victoria and New South Wales only - nothing is published here for QLD yet. Check the airport's noise contours and the local planning scheme.
Land contamination checks
Not mappedWe hold official contaminated-land overlay mapping for Victoria only - nothing is published here for QLD yet. Check the state environment authority's contaminated land register and the local planning scheme.
Acid sulfate soils
Not publishedWe hold acid sulfate soil mapping for Victoria and New South Wales only - nothing is published here for QLD yet. Coastal and estuarine land is where these soils occur; check the state's soil mapping and the local planning scheme.
Recorded crime
Not publishedQLD does not release the suburb-level incident counts we republish for New South Wales and Victoria, so we show none here.
Social housing
Census figure2.6% rented from a state or territory housing authority · 0.4% from a community housing provider
Share of occupied private dwellings here with a stated tenure (Census 2021). The middle QLD area is 1.6% public and 0.4% community, across 531 areas. Listed because families ask; it is a fact about who owns the homes, not a judgement about the people in them.
About this data
Every line is an official published record for the Kingaroy area - we don't rate, score or rank any of them. Where a line is missing, treat it as not checked rather than clear. What each line covers and does not →
Source: ABS Census 2021 (G37 tenure and landlord type) · © OpenStreetMap contributors (ODbL) - road classification
Nearby suburbs
- Kingaroy Surrounds (South area) 4.3 km
- Nanango 31 km
- Kingaroy Surrounds (North area) 33 km
- Kilkivan 64 km
- Crows Nest (Rosalie area) 65 km
- Kilcoy 75 km
The six closest profiled areas in Queensland, by distance between area centres.
Other areas in Burnettsorted by growth in one year
More in Queensland
Alexandra Hills
QLDAlexandra Hills is a locality in the Capalaba area of Queensland. This profile draws on ABS population and Census figures, the ACARA school register and ACECQA childcare ratings for the Alexandra Hills SA2.
Belmont - Gumdale
QLDBelmont - Gumdale is a locality in the Capalaba area of Queensland. This profile draws on ABS population and Census figures, the ACARA school register and ACECQA childcare ratings for the Belmont - Gumdale SA2.
Birkdale
QLDBirkdale is a locality in the Capalaba area of Queensland. This profile draws on ABS population and Census figures, the ACARA school register and ACECQA childcare ratings for the Birkdale SA2.
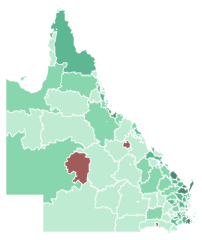
Where this is in QLD