Northmead
New South Wales · Parramatta, Sydney - Parramatta
Live · ABS ERP June 2025
The median age is 34, lower than the middle New South Wales area (40, Census 2021). A 3-bedroom house rents for $850 a week, against $713 in the middle New South Wales area. The median house price in Northmead is $1.67M, about 31% above the middle New South Wales area ($1.28M).
Northmead has 9 schools (6 government, 3 non-government; ACARA School Profile 2025) and 10 NQS-rated childcare services (ACECQA register). Population is 21,799 (ABS ERP June 2025).
Northmead at a glance
Found this useful? Share it with a friend who is moving.

Boundaries: ABS Suburbs & Localities 2021. School pins are ACARA's published locations. Map © OpenStreetMap contributors, © CARTO. Open the full NSW map →
How the Family-Fit score is built77/100
Family-Fit score
Method published in fullStrong for families - strongest on childcare & early years, weakest on housing affordability.
- Schools in the area · 20% of the score
- 90/100
- Childcare & early years · 15% of the score
- 100/100
- Everyday amenities · 15% of the score
- 88/100
- Getting around · 15% of the score
- 50/100
- Housing affordability · 15% of the score
- 48/100
- Families already here · 10% of the score
- 82/100
- Socio-economic profile · 10% of the score
- 78/100
NSW median 70/100
9 schools in this SA2 · average government-school ICSEA 1050
NSW median 90/100
10 NQS-rated services nearby
NSW median 78/100
14 parks · 2 GPs · 4 supermarkets · 9 playgrounds
NSW median 50/100
1 train station in this SA2 (no train-time data for NSW yet)
NSW median 38/100
Paying over 30% of income on housing: 18.4% of mortgage-holding households, 25.5% of renting households
NSW median 67/100
19.7% of residents are children aged 0–14 · 49.8% of families are couples with children
NSW median 56/100
SEIFA IRSAD decile 8 of 10 nationally
The grey marker on each bar is the median across the 612 New South Wales areas we publish a score for (state median overall: 64/100). It is context, not a pass mark.
How this score is calculated
Each published figure for the Northmead SA2 is mapped onto 0–100 by fixed thresholds, then weighted. Inputs with no data here are dropped and the rest rescaled - never scored as zero. Every threshold and weight →
School results, crime and flood or bushfire overlays are not graded into this score. Limits of the score →
What families notice
What families notice
- This address is zoned to Northmead Public School (government, no fees).
- Recorded incidents are down 21% on the year before.
- Ranks in the top 30% for socio-economic advantage in NSW (ABS SEIFA - not a safety or school-quality measure).
Living in Northmead: family snapshot
Living in Northmead
A large suburb. Strong India communities here (2021 Census). Many childcare options nearby - 10 NQS-rated services. Mostly apartments and units.
Northmead compared with New South Wales10 measures
| Measure | Northmead | NSW average | Against NSW |
|---|---|---|---|
| Children aged 0 to 4 | 8.0% | 5.8% | Higher |
| Children aged 5 to 14 | 11.8% | 12.4% | About the same |
| Couple families with children | 49.8% | 44.5% | Higher |
| One-parent families | 13.1% | 15.9% | Lower |
| Homes owned outright | 16.7% | 31.9% | Lower |
| Homes owned with a mortgage | 28.5% | 33.7% | Lower |
| Homes rented | 52.3% | 32.5% | Higher |
| Separate houses | 28.4% | 67.4% | Lower |
| Flats and apartments | 57.8% | 20.3% | Higher |
| Born overseas | 50.4% | 29.3% | Higher |
Source: ABS Census 2021. The NSW figure is the population-weighted average of the 641 NSW areas with a published value. "Higher" and "Lower" describe the number only.
About this area and its boundary
Northmead is a locality in the Parramatta area of New South Wales. This profile draws on ABS population and Census figures, the ACARA school register and ACECQA childcare ratings for the Northmead SA2.
21,799 residents - 19.7% are children under 15, median age 34, the largest overseas-born community is India (19.9%).
This profile uses the ABS Northmead statistical area (SA2) - the level Australian government data is published at. SA2 boundaries don’t always match suburb boundaries. It covers the gazetted suburb of Northmead, drawn separately on the map above.
Property market
The median house price is $1,670,000, down 0.6% in a year, and a 3-bedroom house rents for a median $850 a week.
Source: NSW DCJ Sales Mar 2026 · Rent Jun 2026. © State of New South Wales (Department of Communities and Justice), licensed under CC BY 4.0 (copyright notice).
Homes and households
Source: ABS Census 2021. Where the shares do not add to 100%, the rest is "other" or "not stated".
Housing cost pressuremortgage and rent against income
Housing cost pressure
In Northmead, 25.5% of renting households spend more than 30% of their income on rent, and 18.4% of households with a mortgage spend more than 30% on repayments - the ABS's stretched-household threshold (Census 2021).
ABS published figures, not our calculation.
- Mortgage over 30% of income
- 18.4%
- Rent over 30% of income
- 25.5%
NSW avg 17.3%
Share of households WITH a mortgage whose repayments take more than 30% of income. That's 400 of 1,984 households with a stated repayment.
NSW avg 35.5%
Share of RENTING households whose rent takes more than 30% of income. That's 1,014 of 3,738 households with a stated rent.
The two figures cover different households (mortgage-holding vs renting), so never add them. How the ABS counts these → Grey marker: NSW average (622 for mortgage and 622 for rent). Census 2021 - housing costs have moved since. Not financial advice.
What's being built herenew homes approved, year by year
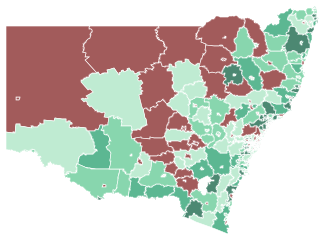
What's being built here
211 new homes were approved in Northmead in the year to June 2025. Councils approved 847 new dwellings here across the 6 years to June 2025 - an approval is permission to build, not a home that exists yet.
Approved in the year to June 2025
Middle NSW area: 37
Separate houses
Private sector, over these 6 years
Townhouses & apartments
Private sector, over these 6 years
Counts are for the whole Northmead statistical area. What these counts include → Dashed line: the median of 599New South Wales areas.
Schools and childcare
9 schools are located in the area, and the centre of the area is zoned to Northmead Public School. 10 childcare services are on the national register, 6 rated Meeting the National Quality Standard or above.
Northmead Public School
The government school your child can attend for free by living in Northmead.
This is the zoned government school for the centre of Northmead (NSW catchment data) - addresses elsewhere in the suburb may be zoned to a different school.
See the catchment on the mapThe government Year 7 zone for the centre of Northmead (NSW catchment data) - addresses elsewhere in the suburb may be zoned to a different school.
Fee-paying schools can’t be enrolled in by zone - they’re shown for context, not as the area’s school quality.
We show school intake context and catchments, not exam results. We don’t publish a school ranking.
All school zones in the Parramatta council area →
To look beyond Northmead, every New South Wales school is on the Australian schools and catchment zones map.
Find the school zone for an address in Northmead
Type a street address in Victoria, NSW or Queensland. We show the government primary and secondary school zones it is in, from the official zone maps.
Your address goes from your browser straight to OpenStreetMap's address search to find it on the map. We never see it or store it. Address search © OpenStreetMap contributors.
Schools in Northmead
- Students
- 614
- ICSEA
- 1082
- Students
- 1,239
- ICSEA
- 1069
- Students
- 1,210
- ICSEA
- 1087
- Students
- 1,043
- ICSEA
- 1086
- Students
- 389
- ICSEA
- 1121
- Students
- 112
- ICSEA
- 1046
- Students
- 46
- ICSEA
- 1001
- ICSEA
- not published
- ICSEA
- not published
ICSEA reflects student intake context, not teaching quality (1000 = national average). Source: ACARA School Profile 2025. All NSW schools →
Childcare: 10 services
National Quality Standard ratings from the ACECQA register, refreshed Oct 2026. Services are matched by suburb name.
Childcare services, ratings and fees10 services
- Meeting NQSChildren's Village NorthmeadCentre-Based Care · 92 places · NorthmeadRated Jun 2024
- Meeting NQSNorthmead Child Care & Early Learning CentreCentre-Based Care · 64 places · NorthmeadRated Jul 2023 · over 3 years old, check for a more recent assessment
- Meeting NQSWhiz Kidz Early Learning Centre and Preschool NorthmeadCentre-Based Care · 51 places · NorthmeadRated May 2023 · over 3 years old, check for a more recent assessment
- Meeting NQSNorthmead Redbank Children's CentreCentre-Based Care · 45 places · NorthmeadRated Jul 2026
- Meeting NQSIntegricare Early Learning Centre NorthmeadCentre-Based Care · 40 places · NorthmeadRated Sep 2023 · over 3 years old, check for a more recent assessment
- Meeting NQSJolly Frog KindergartenCentre-Based Care · 20 places · NorthmeadRated Nov 2025
- Working Towards NQSNorthmead Before and After School Care IncorporatedCentre-Based Care · 120 places · NorthmeadRated Nov 2022 · over 3 years old, check for a more recent assessment
- Not yet ratedHand in Hand Early Learning Centre NorthmeadCentre-Based Care · 90 places · Northmead
- Not yet ratedNorthmead Montessori AcademyCentre-Based Care · 63 places · Northmead
- Not yet ratedWHIZ KIDZ EARLY LEARNING CENTRE NORTHMEAD 2Centre-Based Care · 32 places · Northmead
- Centre-based day care
- $13.55/hr
- Outside school hours care
- $9.52/hr
Mean hourly fee across CCS-approved services, December quarter 2025 - Dept of Education, © Commonwealth of Australia, CC BY 4.0. Published at SA3 level (a wider area than this suburb's SA2), so it's an average across Parramatta and surrounds, not this specific service list.
Verify locations before visiting. A rating over 3 years old is flagged. What the NQS ratings mean → Childcare places per child, by suburb →
Who lives here
More people born overseas than New South Wales overall: 50.4% of residents, against 29.3% statewide.
Ages of people here
Share of residents in each age band, in years. Source: ABS Census 2021.
How the area is changingCensus 2011 to 2021
Each line is drawn on its own scale, so compare the numbers, not the heights. Source: ABS Census 2011, 2016 and 2021; Travel Zone Projections 2024 (TZP24), Transport for NSW forecast, published for the council area, not the suburb.
Census trends against the middle NSW areafull charts
Which way this area is moving
The 2011, 2016 and 2021 Censuses for Northmead, counted on today's boundaries.
Since 2011, Northmead has grown older, with more residents born overseas and more residents speaking another language at home.
- People counted
- +2,987 people since 2011
- Median age
- +2 years since 2011
- Children aged 0–14
- +0.9 pts since 2011
- Born overseas
- +2.6 pts since 2011
- Speak another language at home
- +4.2 pts since 2011
Usual residents counted on Census night.
Half the residents are older than this, half younger.
Share of all residents. The clearest signal of families arriving or moving on.
Share of all residents born outside Australia.
Share of residents who stated a language, speaking one other than English at home.
The dashed line is the median across the New South Wales areas we profile. How the three Censuses line up →
How many people will live around hereofficial forecast
How many people will live around here
The rest of this page looks backwards. This is the one number that looks forward - and it is the state government's own, not ours. Travel Zone Projections 2024 (Transport for NSW) projects the Parramatta council area, which contains Northmead along with its neighbouring suburbs, to grow to 366,520 people by 2041: 108,280 more people than the 258,240 counted in 2021.
This is the council area, not Northmead. Parramatta is a whole local government area covering many suburbs, and neither state publishes a projection for a single suburb. Growth is never spread evenly across a council - a greenfield estate and an established street inside the same council will move very differently - so read this as the direction of the wider area a suburb sits in, not as a forecast for its own streets. Only the years the publisher itself lists are plotted: nothing is filled in between them, and nothing is carried past 2041. A projection is an assumption about the future, not a measurement of it, and it will be revised - this one was released 2024. These figures sit on the projection's own series, so they are not directly comparable with the ABS resident-population and Census counts elsewhere on this page, which use different geographies and different years.
Where this year's population change came from+0.30% in a year
Where did the gain come from?
+62Reading the streams: overseas arrivals were the dominant force - more came from abroad than the suburb grew on its own.
Ages against the state average, band by band
Ages of people here
11.8% of people here are school-age children (5–14) - about the New South Wales average of 12.4%, and 8% are under 5. The median age is 34.
- 0–4 years · before school
- 8%
- 5–14 years · school age
- 11.8%
- 15–19 years · teens
- 3.8%
- 20–34 years
- 27.4%
- 35–54 years
- 30.2%
- 55–64 years
- 7.5%
- 65 years and over
- 11.5%
NSW avg 5.8%
NSW avg 12.4%
NSW avg 5.7%
NSW avg 20.3%
NSW avg 26.3%
NSW avg 11.9%
NSW avg 17.6%
Share of all residents of Northmead (ABS Statistical Area 2) at the 2021 Census; the grey marker is the New South Wales average. How the bands and averages work →
Households and families
Households and families
63% of families here have children living at home - more than the New South Wales average of 60%. The largest overseas-born communities are India (19.9%), China (3.3%) and Nepal (2.3%). 52% of homes are rented.
Family make-up
Share of all families in the area. A small "other family" group the ABS also counts is not shown.
- Couple with children
- 49.8%
- One-parent family
- 13.1%
- Couple, no children
- 35.1%
NSW avg 44.5%
NSW avg 15.9%
NSW avg 37.9%
What people live in
Share of occupied private dwellings. Other and unstated structures are not shown.
- Separate house
- 28.4%
- Semi-detached / townhouse
- 13.8%
- Flat or apartment
- 57.8%
NSW avg 67.4%
NSW avg 11.6%
NSW avg 20.3%
Owned or rented
Share of occupied private dwellings. Other and unstated tenures are not shown.
- Owned outright
- 16.7%
- Owned with a mortgage
- 28.5%
- Rented
- 52.3%
NSW avg 31.9%
NSW avg 33.7%
NSW avg 32.5%
Figures describe Northmead (ABS Statistical Area 2) at the 2021 Census; the grey marker is the New South Wales average. How these are counted →
Birthplaces, languages and communities
Who lives in Northmead
Top 5 overseas birthplaces shown · 70.4% born in Australia or a country not in the top five.
- India · established by 2016
- 19.9%
- China · established by 2016
- 3.3%
- Nepal · growing since 2016
- 2.3%
- Philippines · established by 2016
- 2.3%
- Iran · established by 2016
- 1.8%
NSW avg 2.3%
NSW avg 2.9%
NSW avg 0.6%
NSW avg 0.9%
NSW avg 0.1%
- Co-located communities
- Northmead is home to established India, China, Nepal and Philippines communities - each is 2% or more of residents born overseas here, not a ranking of one against another.
- Nearby
- North Parramatta, Wentworthville - Westmead and Toongabbie - Constitution Hill also have an established India community.
- Settlement pattern
- Of overseas-born residents who stated when they arrived, 34.6% arrived in the last 5 years (2016–2021) (NSW avg 16.2%) and 25.3% arrived before 2001 (NSW avg 52%).
- English at home
- Of residents who speak a language other than English at home and stated their English proficiency, 10.9% report speaking English “not well” or “not at all” (NSW avg 13.5%) - a self-reported ABS figure across all languages combined, not a judgement of any one community.
Figures describe Northmead (ABS Statistical Area 2) at the 2021 Census. The ABS publishes only the five largest communities per area, so a missing name did not rank in the top five. How these are counted →
Community guides that include Northmead: Indian community in Sydney
Socio-economic index (SEIFA)decile 8 of 10
- Decile (1 lowest, 10 highest)
- Decile 8 of 10
- Where this sits in NSW
- top 30% of New South Wales areas
A relative comparison of the whole area against all of Australia - not a safety, liveability, or school-quality measure. What IRSAD measures → Source: ABS SEIFA 2021, IRSAD index (SA2).
Getting around and lifestyle
4 supermarkets, 2 GPs and 14 parks are mapped in the area, and the nearest emergency department is The Children's Hospital at Westmead, 1.3 km away in a straight line.
Mapped inside the Northmead boundary. A zero can mean "not mapped" rather than "not there". Source: © OpenStreetMap contributors.
Train to the city and nearest emergency department
Train to the city
Not publishedNew South Wales publishes its timetable data behind a free developer account we have not yet set up, so we show no travel time here. This is a gap on our side, not a statement about the transport in this area.
Nearest emergency department
MappedThe Children's Hospital at Westmead · 1.3 km
Straight-line distance from the middle of this area - not a drive time. In an emergency call 000; do not plan around this figure.
Community and recreation
Out with a baby
Public-toilet facilities recorded on the National Public Toilet Map - not every place in the area that will let you change a baby.
About this data
Counts of features tagged in OpenStreetMap inside the Northmead boundary. “Middle NSW area”: the median of 634 New South Wales areas. How these counts and times are made →
Source: © OpenStreetMap contributors · baby-facility counts from the National Public Toilet Map (Continence Foundation of Australia, funded by the Australian Government Department of Health, Disability and Ageing, CC BY 3.0 AU)
Crime & safety in Northmead
Police recorded 428 incidents in Northmead in Jan-Dec 2025, down 21% on the year before. This is a raw count, not a rate or a rating.
Largest offence categories
LGA rate, as published: Parramatta council areaJuly 2025 - June 2026
These rows cover the whole Parramatta council area, which is larger than Northmead. The agency publishes a rate for each major offence, not one total, so there is no total row. We do not calculate rates.
| Offence | Recorded incidents | Per 100,000 people |
|---|---|---|
| Domestic violence related assault | 920 | 334.6 |
| Non-domestic violence related assault | 975 | 354.6 |
| Sexual assault | 241 | 87.7 |
| Sexual touching, sexual act and other sexual offences | 234 | 85.1 |
| Robbery | 61 | 22.2 |
| Break and enter dwelling | 661 | 240.4 |
| Break and enter non-dwelling | 213 | 77.5 |
| Motor vehicle theft | 385 | 140.0 |
| Steal from motor vehicle | 939 | 341.5 |
| Steal from retail store | 1,491 | 542.3 |
| Other stealing offences | 1,732 | 629.9 |
| Malicious damage to property | 1,024 | 372.4 |
Source: NSW Bureau of Crime Statistics and Research, July 2025 - June 2026, accessed 11 October 2026.
Is Northmead safe? Here's what police recorded
Police recorded 428 criminal incidents in Northmead in Jan-Dec 2025 (NSW Bureau of Crime Statistics and Research (BOCSAR), released 2026 Q3). NSW Bureau of Crime Statistics and Research publishes rates per 100,000 people for Parramatta council area one offence at a time, not as a single total (July 2025 - June 2026); they are listed on this page. Counts are often higher where many people visit (shopping centres, stations, nightlife), not only where many people live. SuburbRadar does not rate suburbs as safe or unsafe.
How much crime is recorded in Northmead?
428 incidents in Jan-Dec 2025, against 545 the year before. The largest offence categories were Theft (203), Against justice procedures (52), Assault (50). These are raw counts as published, not adjusted for population. Source: NSW Bureau of Crime Statistics and Research (BOCSAR), released 2026 Q3. Counts are often higher where many people visit (shopping centres, stations, nightlife), not only where many people live. SuburbRadar does not rate suburbs as safe or unsafe.
Police-recorded incident counts (Calendar years; latest = Jan-Dec 2025). Raw counts, not a rate, and not a judgement about the suburb. Counts are often higher where many people visit (shopping centres, stations, nightlife), not only where many people live. SuburbRadar does not rate suburbs as safe or unsafe. Source: NSW Bureau of Crime Statistics and Research (BOCSAR), released 2026 Q3. More on crime & safety →
© State of New South Wales (Department of Communities and Justice), licensed under CC BY 4.0 (copyright notice). Suburb totals are added up from published figures.
Risks
4 of the 4 planning and hazard records we hold show something in this area: bushfire, heritage controls, traffic noise and acid sulfate soils. 3 more are not published for NSW - treat them as not checked.
Bushfire
Designated Bush Fire Prone LandPresent in this area
Heritage controls
In an official overlayPresent in this area
Traffic noise
Freeway or highway presentBriens Road · Old Windsor Road · James Ruse Drive · +4 more
Acid sulfate soils
Classified in the local planPresent in this area
Each line is the extent of an official record across the whole Northmead area - not a risk rating, and a specific address may or may not be affected. Not financial or insurance advice.
All 9 checks and what each one means
Flooding
Not publishedNew South Wales publishes flood planning maps council by council, with no free statewide layer we can republish - check the local council's flood planning map for this area.
Bushfire
Designated Bush Fire Prone LandPresent in this area
Part of this area is mapped as Bush Fire Prone Land by the NSW Rural Fire Service. This designation is drawn broadly around vegetation across most of NSW, so read it as "check the property", not as a measure of how exposed the area is.
Heritage controls
In an official overlayPresent in this area
Part of this area sits inside the heritage layer in the local environmental plan, so changes to buildings there - extensions, demolition, sometimes even paint colours - need planning approval. It applies property by property: most homes in an area with an overlay are not in it, and being in one is a protection as much as a restriction. Almost every NSW area contains some heritage-listed land, so read this as "check the address", not as something that sets this area apart.
Traffic noise
Freeway or highway presentBriens Road · Old Windsor Road · James Ruse Drive · +4 more
7 named roads through this area carry OpenStreetMap's highest classification - a freeway, motorway or major highway, whatever the road is called locally, alongside 3 named main roads. Roads are counted by name, not by mapped segment. Where a home sits relative to them matters far more than the count - a street two blocks back can be quiet.
Aircraft noise
Not mappedNew South Wales maps aircraft-noise contours only where a council or precinct plan writes them in - four councils and the Western Sydney Airport precinct do. Sydney Airport's contours are published federally in its master plan and are not in the state layer, so read this as "nothing mapped here", not as a quiet area.
Land contamination checks
Not mappedNew South Wales records contaminated land in the EPA's searchable register of notified sites rather than in a planning-scheme map layer, so we have no overlay to show for this area. Search the NSW EPA contaminated land record for a specific address - nothing mapped here means we have not checked it, not that the land is clear.
Acid sulfate soils
Classified in the local planPresent in this area
Part of this area is classified for acid sulfate soils in the local environmental plan, which means work disturbing the soil below a set depth needs council consent. Acid sulfate soils are harmless while they stay wet and buried; digging into them - for a pool, footings, a basement or drainage - exposes them to air and produces acid that eats concrete and steel and can kill fish downstream, so excavation may need a management plan. The class describes how close the soils are likely to sit to the surface, not how bad they are. Much of the low-lying land around the coast and its rivers is classified, so read this as "check before you dig", not as something that sets this area apart.
Recorded crime
Official counts published428 incidents
Police-recorded criminal incidents in Calendar years; latest = Jan-Dec 2025, down 21% on the prior year. A count, not a rate - busier areas with more shops, stations and visitors record more incidents than quiet ones of the same size. Full breakdown ↑
Social housing
Census figure3.2% rented from a state or territory housing authority · 1.4% from a community housing provider
Share of occupied private dwellings here with a stated tenure (Census 2021). The middle NSW area is 1.6% public and 0.7% community, across 624 areas. Listed because families ask; it is a fact about who owns the homes, not a judgement about the people in them.
About this data
Every line is an official published record for the Northmead area - we don't rate, score or rank any of them. Where a line is missing, treat it as not checked rather than clear. What each line covers and does not →
Source: NSW Rural Fire Service Bush Fire Prone Land, © State Government of NSW and NSW Rural Fire Service · NSW Planning EPI Heritage, Airport Noise + Acid Sulfate Soils, © State of New South Wales, Department of Planning, Housing and Infrastructure - CC BY 4.0 · NSW Bureau of Crime Statistics and Research (BOCSAR), released 2026 Q3 · ABS Census 2021 (G37 tenure and landlord type) · © OpenStreetMap contributors (ODbL) - road classification
Nearby suburbs
- North Parramatta 2.0 km
- Wentworthville (Westmead area) 2.1 km
- Toongabbie (Constitution Hill area) 2.2 km
- Parramatta (North area) 2.5 km
- Winston Hills 2.8 km
- Parramatta (South area) 3.1 km
The six closest profiled areas in New South Wales, by distance between area centres.
Other areas in Parramattasorted by growth in one year
More in New South Wales
Braidwood
NSWBraidwood is a locality in the Queanbeyan area of New South Wales. This profile draws on ABS population and Census figures, the ACARA school register and ACECQA childcare ratings for the Braidwood SA2.
Karabar
NSWKarabar is a locality in the Queanbeyan area of New South Wales. This profile draws on ABS population and Census figures, the ACARA school register and ACECQA childcare ratings for the Karabar SA2.
Queanbeyan
NSWQueanbeyan is a locality in the Queanbeyan area of New South Wales. This profile draws on ABS population and Census figures, the ACARA school register and ACECQA childcare ratings for the Queanbeyan SA2.
Where this is in NSW